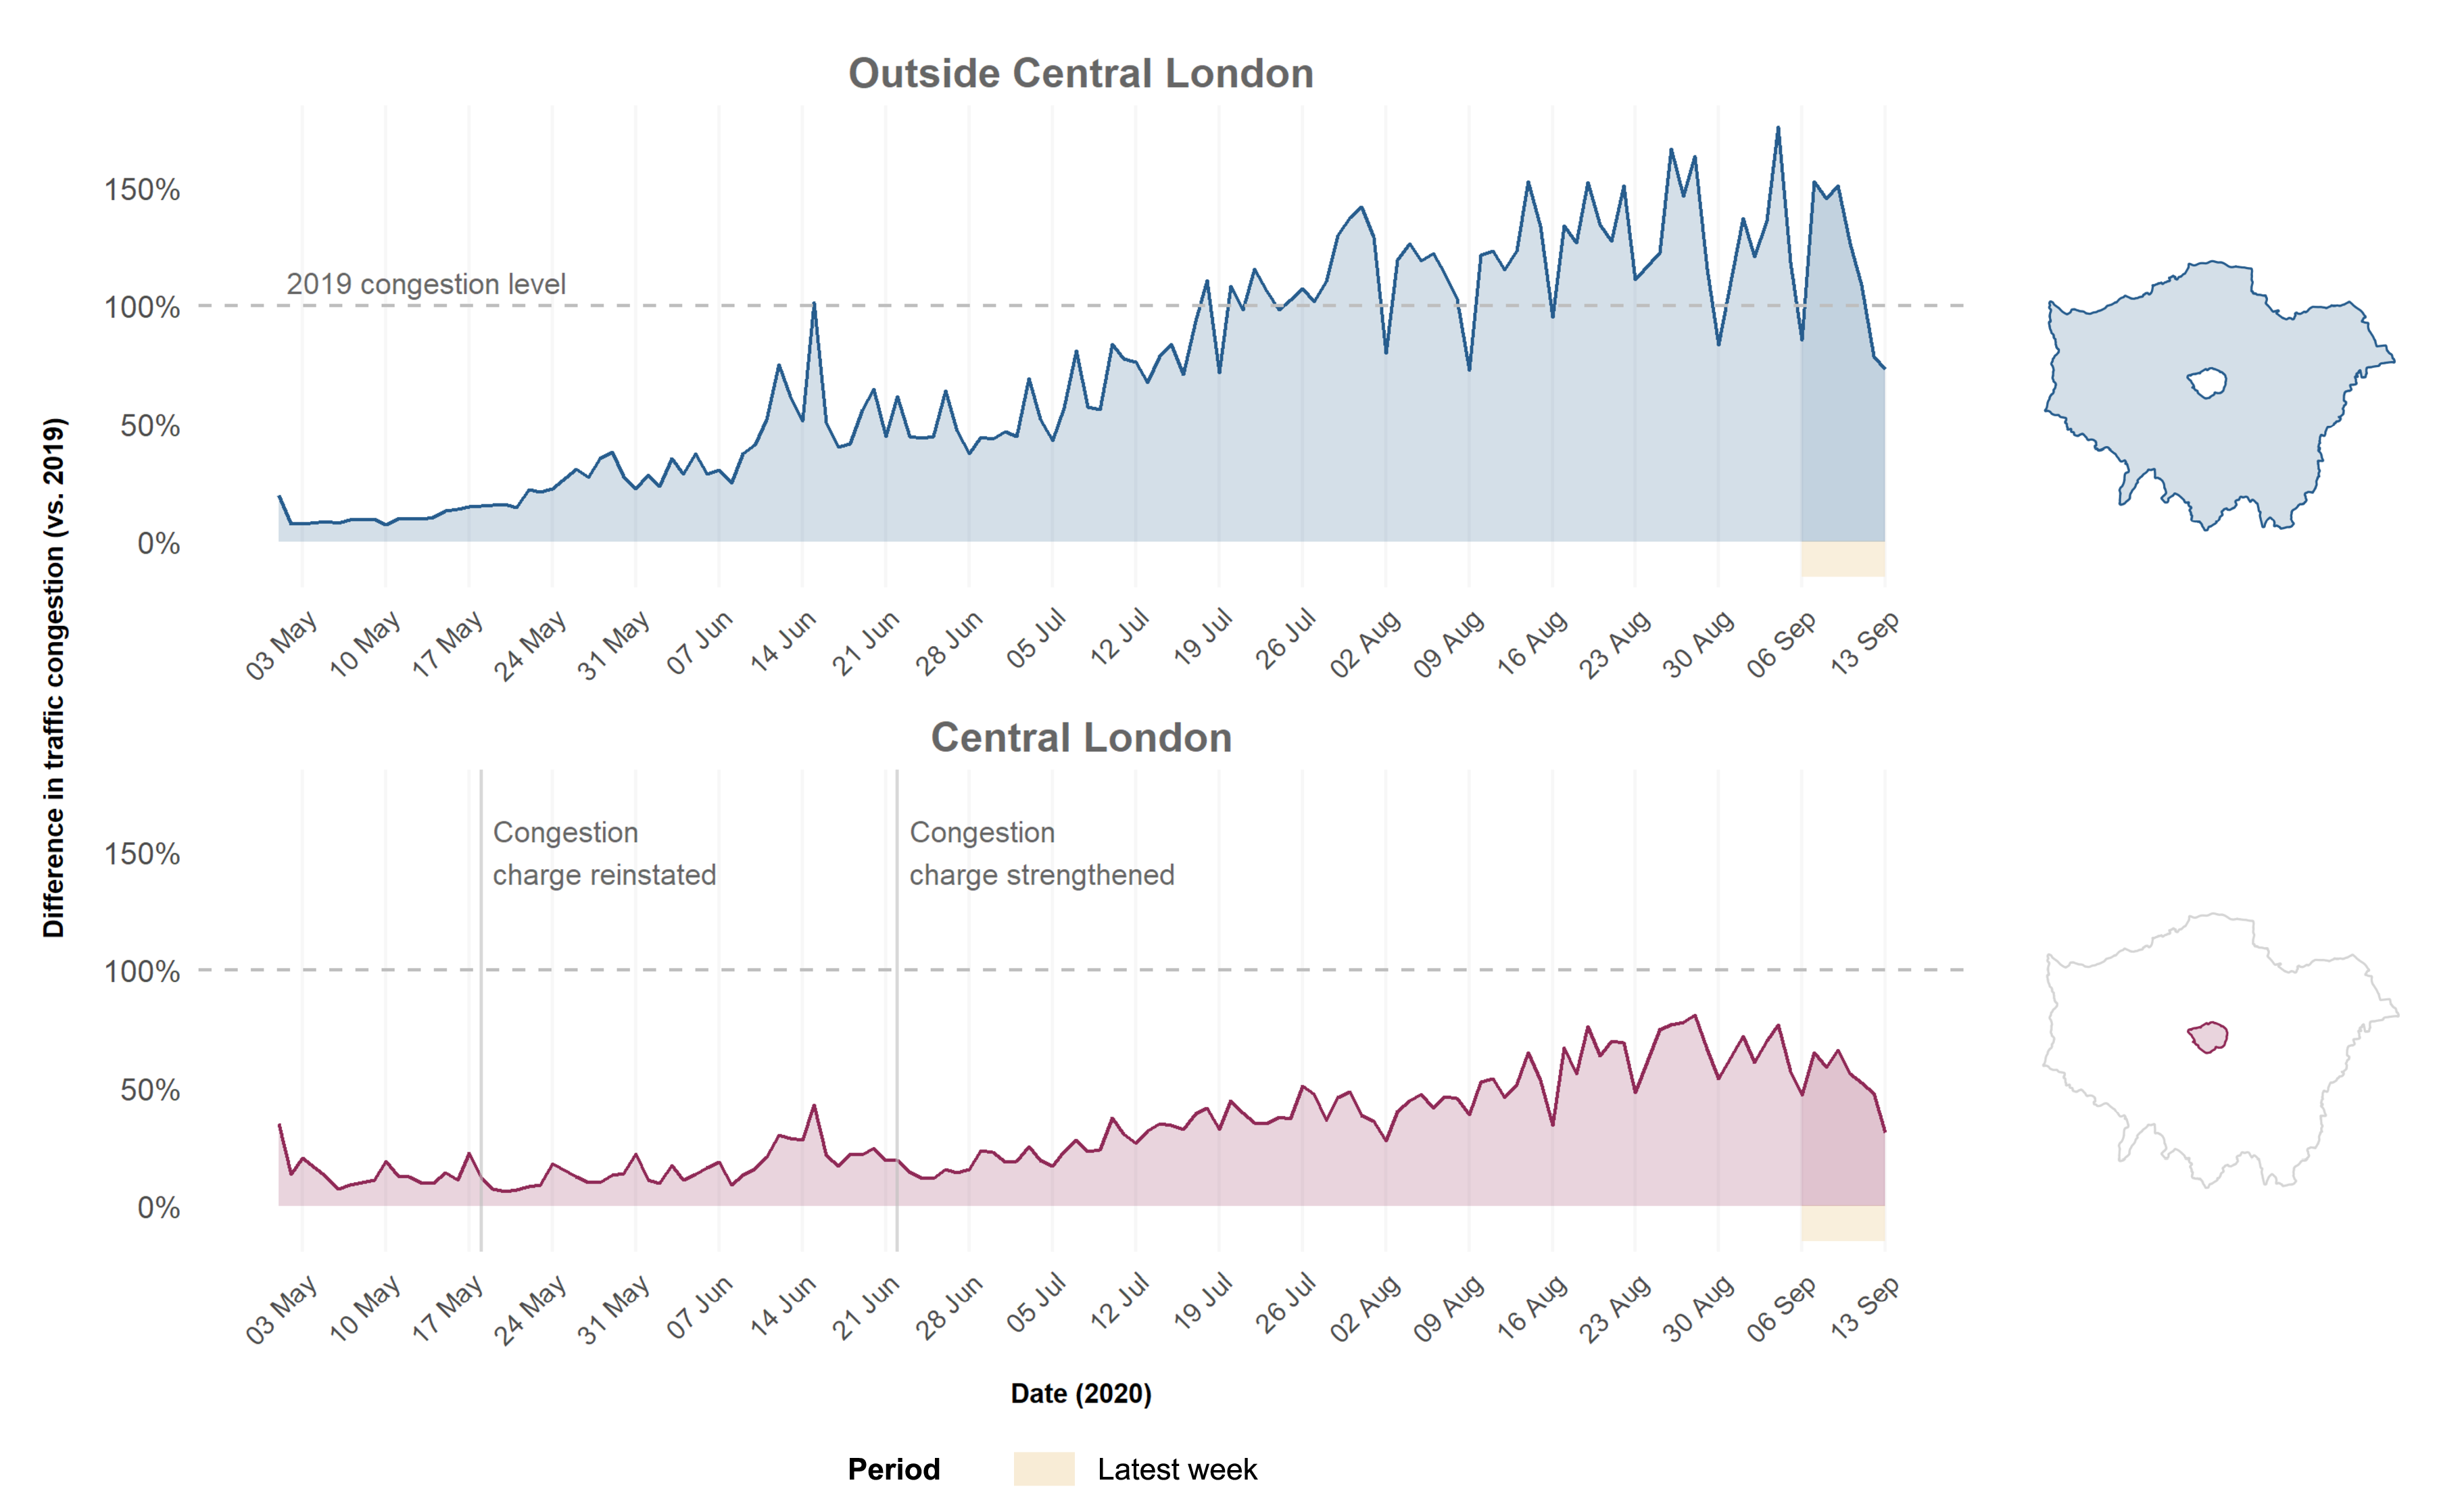
For the most recent chart of London's traffic congestion, see here.
- Traffic congestion outside city centre now worse than 2019 levels
- Concern of gridlock and car-led recovery as city emerges from lockdown
- City centre congestion creeping up
A new analysis by Environmental Defense Fund Europe (EDF Europe), based on data from the Waze for Cities Programme, shows that traffic congestion is currently increasing in London and it is now worse than 2019 levels outside the city centre. The analysis examines data from May 2020 onwards.
In the last week, average congestion on roads outside the central London Congestion Charging zone was 18% higher than last year. The most congested day was Monday 7th September, when congestion was 153% of 2019 levels. This compares to roads within the zone, which were on average last week just 55% of 2019 levels, up from the lowest point of 6% recorded week commencing 4th May 2020.
Congestion in central London is lower than usual, helped by changes to the Congestion Charge scheme and fewer visitors to the area. However, city centre traffic congestion will need to be closely monitored given there has been a steady increase over the past few weeks.

New data from the Department of Transport also shows a near 50% increase in van mileage on urban roads in the past decade.
Traffic congestion disrupts essential journeys and creates unpleasant places to walk and cycle, making it difficult to discourage car use as the city emerges from lockdown.
This is concerning for London’s poor air quality given recent EDF Europe analysis that uncovered nitrogen oxides (NOx) pollution from diesel cars was already higher at study sites outside the centre. In addition to public health impacts, a car-led recovery also has significant risks to road safety, economic recovery and climate change.
Today’s analysis confirms that urgent action is needed to reduce polluting vehicles and congestion on roads outside the city centre, such as improving cycling infrastructure, consolidating increasing van deliveries and better public transport connectivity.
Oliver Lord, Head of Policy and Campaigns at Environmental Defense Fund Europe said: “Traffic congestion is precisely what we should prevent as our polluted city emerges from lockdown. We need to help people get around without private cars because congestion delays buses, disrupts essential trips and makes it horrible to walk and cycle. This analysis is a rallying call for action, including safer streets for cycling instead of driving, more public transport connectivity and a concerted effort from business to curb the record number of vans on our streets.”
Stephen Edwards, Director of Policy & Communications at Living Streets, the charity for everyday walking said: “This concerning data should serve as a warning that the opportunity to embed the health and environmental benefits of fewer vehicles is not lost. Better streets for walking and cycling are better for us all. We must move ahead with schemes to promote these behaviours.”
Notes to Editors
- Methodology is below.
- The ‘last week’ represents seven days, from 7th to 13th September 2020.
- EDF Europe will continue to update this figure on a weekly basis.
- Further assessment is needed to understand the impact of traffic congestion on current levels of air pollution in the city.
- Department of Transport September 2020 report Road Traffic Estimates: Great Britain 2019: https://assets.publishing.service.gov.uk/government/uploads/system/uplo…
- EDF Europe analysis showing levels of NOx air pollution from diesel cars was 23% higher at study sites outside central London Ultra Low Emission Zone https://europe.edf.org/news/2020/19/08/diesel-car-pollution-higher-neighbourhoods-outside-city-centre
Methodology
Traffic data (source: Waze For Cities Programme by permission). Waze congestion alerts are created through a combination of user-generated reports and geolocation data from the million monthly active Waze users in London. A daily measure of traffic congestion for the period of interest was calculated by summing the hourly average length of all unique congestion incidents in Greater London, split into Central London and outside Central London areas. We define a congested road segment as one exhibiting 80% or less of each road’s free flow speed. Note that this data represents unique traffic congestion based on Waze-generated anonymous incident and slow-down information, and should thus be considered as an indicator of overall congestion rather than a true measure.
The year-on-year comparison of this indicator is made by matching each day in 2020 to the equivalent day in 2019 using an offset day-of-year number, ensuring that the same days of the week are matched together. Note that this method means some non-holiday days in 2020 end up being compared to holiday days in 2019, and vice-versa, which can cause a misleading spike or drop in the percentage difference. For this reason bank holiday days have been removed from the chart.
To calculate the year-on-year percentage difference for the latest week, the average daily measure of traffic length for week 37 was compared between 2019 and 2020, and each London area.
Photo sources: Creative Commons by Alfred Hermida; Creative Commons by nikoretro